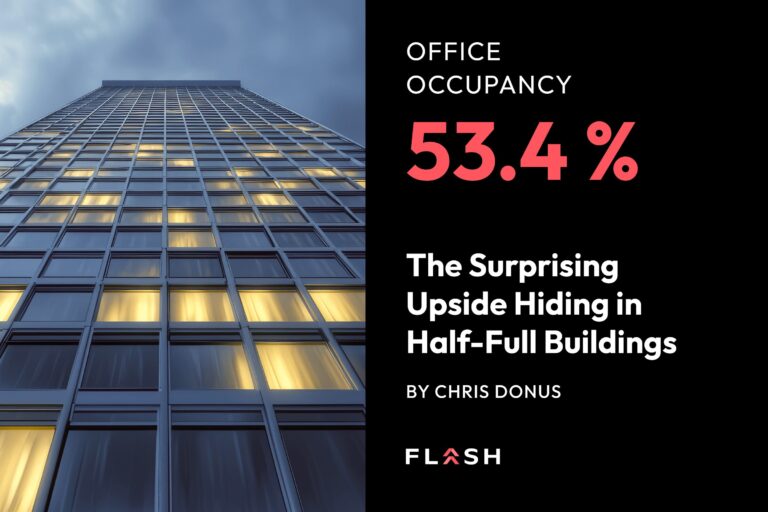
Kastle’s Back-to-Work Barometer update last week caught my attention: average office occupancy across the 10 largest U.S. markets slid to 53.4 percent. On the day of the week with the lowest occupancy, it drops to 34.5 percent.
Even as the return-to-office debate cools, these data reveal attendance that remains stubbornly uneven—crowded mid-week peaks, desert-quiet Mondays and Fridays. For property owners, that variability shows up first in the garage: surplus stalls three days a week, gate queues the other two, and a revenue model designed for “five days, always on” struggling to keep up.
The core insight: static parking supply is out of step with dynamic office demand
When occupancy hovers near 50 percent, predictable monthly contracts leave money on the table while daily parkers shoulder the frustration (and often skip the trip).
But digital, data-driven inventory can flex the moment the building’s headcount does. The garage becomes a real-time marketplace rather than a sunk cost. Two numbers highlight the potential:
- Drivers routinely pay an $18 premium to cut just 0.2 miles of walking distance, climbing past $25 on event nights according to our transaction data.
- Early adopters of data-driven pricing and reservation tools are seeing 30–40 percent yield lifts.
What it means for owners and operators: it pays to manage parking inventory
- Flexible inventory converts variability into NOI. Tenants courting hybrid talent will pay for the assurance that a space is waiting when employees do make the trip. Remaining excess stalls become a flexible pool, bookable by the hour, day, or as a subscription.
- Mid-week surge management matters. Tuesday–Thursday peaks now hit nearly 56 percent of pre-COVID levels, versus low-30’s on fringe days. Context-aware pricing can smooth utilization and protect experience quality when everyone shows up at once.
- Data beats gut feel. Gate counts and LPR reads update every few seconds. Lease rolls update every few years. Owners who stitch those live signals into their ops stack will spot emerging patterns – and revenue opportunities – before the finance team closes the books.
Where it’s heading: glass half-full
I expect the “half-full” office to persist, and with it, we’ll enter an era where experience quality becomes the revenue lever. When it comes to parking, drivers will no longer circle the block and bail but will move to facilities where they can see, reserve, enter, and pay in a single flow. As open APIs knit together parking, charging, and navigation into a unified ecosystem, that seamless journey will feel less like a perk and more like table stakes.
Flash is bringing that ecosystem to life with our AI-powered platform, real-time facility data with our state-of-the-art camera technology, and a demand network already embedded in Waze, Google, and major automakers. The upside is real and shows up in lift, in length-of-stay, and in the machine learning running quietly behind every transaction.
Give it another 12 months, and I believe we’ll talk less about “occupancy recovery” and more about yield expansion because we’ll finally be pricing parking the way airlines price seats: dynamically, intelligently, and in tune with actual demand.
Curious how you’re thinking about mid-week spikes, contract vs. transient mix, or anything else this data raises. Reach out to your Flash rep, or drop me a note. The best insights usually start with “does anyone else see this?”